Tools for maintaining Quino (102 of 278)
Published by marco on
The Quino roadmap shows you where we’re headed. How do we plan to get there?
A few years back, we made a big leap in Quino 2.0 to split up dependencies in anticipation of the initial release of .NET Core. Three tools were indispensable: ReSharper, NDepend and, of course, Visual Studio. Almost all .NET developers use Visual Studio, many use ReSharper and most should have at least heard of NDepend.
At the time, I wrote a series of articles on the migration from two monolithic assemblies (Encodo and Quino) to dozens of layered and task-specific assemblies that allows applications to include our software in a much more fine-grained manner. As you can see from the articles, NDepend was the main tool I used for finding and tracking dependencies.[1] I used ReSharper to disentangle them.
- Splitting up assemblies in Quino using NDepend (Part I)
- Iterating with NDepend to remove cyclic dependencies (Part II)
- The Road to Quino 2.0: Maintaining architecture with NDepend (part I)
- The Road to Quino 2.0: Maintaining architecture with NDepend (part II)
Since then, I’ve not taken advantage of NDepend’s features for maintaining architecture as much as I’d like. I recently fired it up again to see where Quino stands now, with 5.0 in beta.
But, first, let’s think about why we’re using yet another tool for examining our code. Since I started using NDepend, other tools have improved their support for helping a developer maintain code quality.
- ReSharper itself has introduced tools for visualizing project and type dependencies with very nice graphs. However, there is currently no support for establishing boundaries and getting ReSharper to tell me when I’ve inadvertently introduced new dependencies. In fact, ReSharper’s only improved its support for quickly pulling in a dependency with its excellent Nuget-Package integration. ReSharper is excellent for finding lower-level code smells, like formatting, style and null-reference issues, as well as language usage, missing documentation and code-complexity (with an extension). DotCover provides test-coverage data but I haven’t used it for real-time analysis yet (I don’t use continuous testing with ReSharper on Quino because I feel it would destroy my desktop).
- Visual Studio has also been playing catch-up with ReSharper and has done an excellent job in the last couple of years. VS 2017 is much, much faster than its predecessors; without it, we would be foundering badly with a Quino solution with almost 150 projects.[2] Visual Studio provides Code Analysis and Portability Analysis and can calculate Code Metrics. Code Analysis is mostly covered by ReSharper, although it has a few extra inspections related to proper application and usage of the
IDisposablepattern. The Portability Analysis is essential for moving libraries to .NET Standard but doesn’t offer any insight into architectural violations like NDepend does. - We’ve recently started working with SonarQube on our TeamCity build server because a customer wanted to use it. It has a very nice UI and very nice reports, but doesn’t go much farther than VS/R# inspections. Also, the report isn’t in the UI, so it’s not as quick to jump into the code. I don’t want to review it here, since we only recently started working with it. It looks promising and is a welcome addition to that project. Hopefully more will reveal itself in time.
- TeamCity provides a lot of the services that ReSharper also provides: inspections and code-coverage for builds. This takes quite a while, though, so we only run inspections and coverage for the Quino nightly build. The reports are nice but, as with SonarQube, of limited use because of the tenuous integration with Visual Studio. The integration works, but it’s balky and we don’t use it very much. Instead, we analyze inspections in real-time in Visual Studio with ReSharper and don’t use real-time code-coverage.[3]
- NDepend integrates right into Visual Studio and has a super-fast analysis with a very nice dashboard overview, from which you can drill down into myriad issues and reports and analyses, from technical debt (with very daunting but probably accurate estimates for repair) to type- and assembly-interdependency problems. NDepend can also integrate code-coverage results from DotCover to show how you’re doing on that front on the dashboard as well. As with TeamCity and SonarQube, the analyses are retained as snapshots. With NDepend, you can quickly compare them (and comparing against a baseline is even included by default in the dashboard), which is essential to see if you’re making progress or regressing.[4] NDepend also integrates with TeamCity, but we haven’t set that up (yet).
With a concrete .NET Core/Standard project in the wings/under development, we’re finally ready to finish our push to make Quino Core ready for cross-platform development. For that, we’re going to need NDepend’s help, I think. Let’s take a look at where we stand today.
The first step is to choose what you want to cover. In the past, I’ve selected specific assemblies that corresponded to the “Core”. I usually do the same when building code-coverage results, because the UI assemblies tend to skew the results heavily. As noted in a footnote below, we’re starting an effort to separate Quino into high-level components (roughly, a core with satellites like Winform, WPF and Web). Once we’ve done that, the health of the core itself should be more apparent (I hope).
For starters, though, I’ve thrown all assemblies in for both NDepend analysis as well as code coverage. Let’s see how things stand overall.
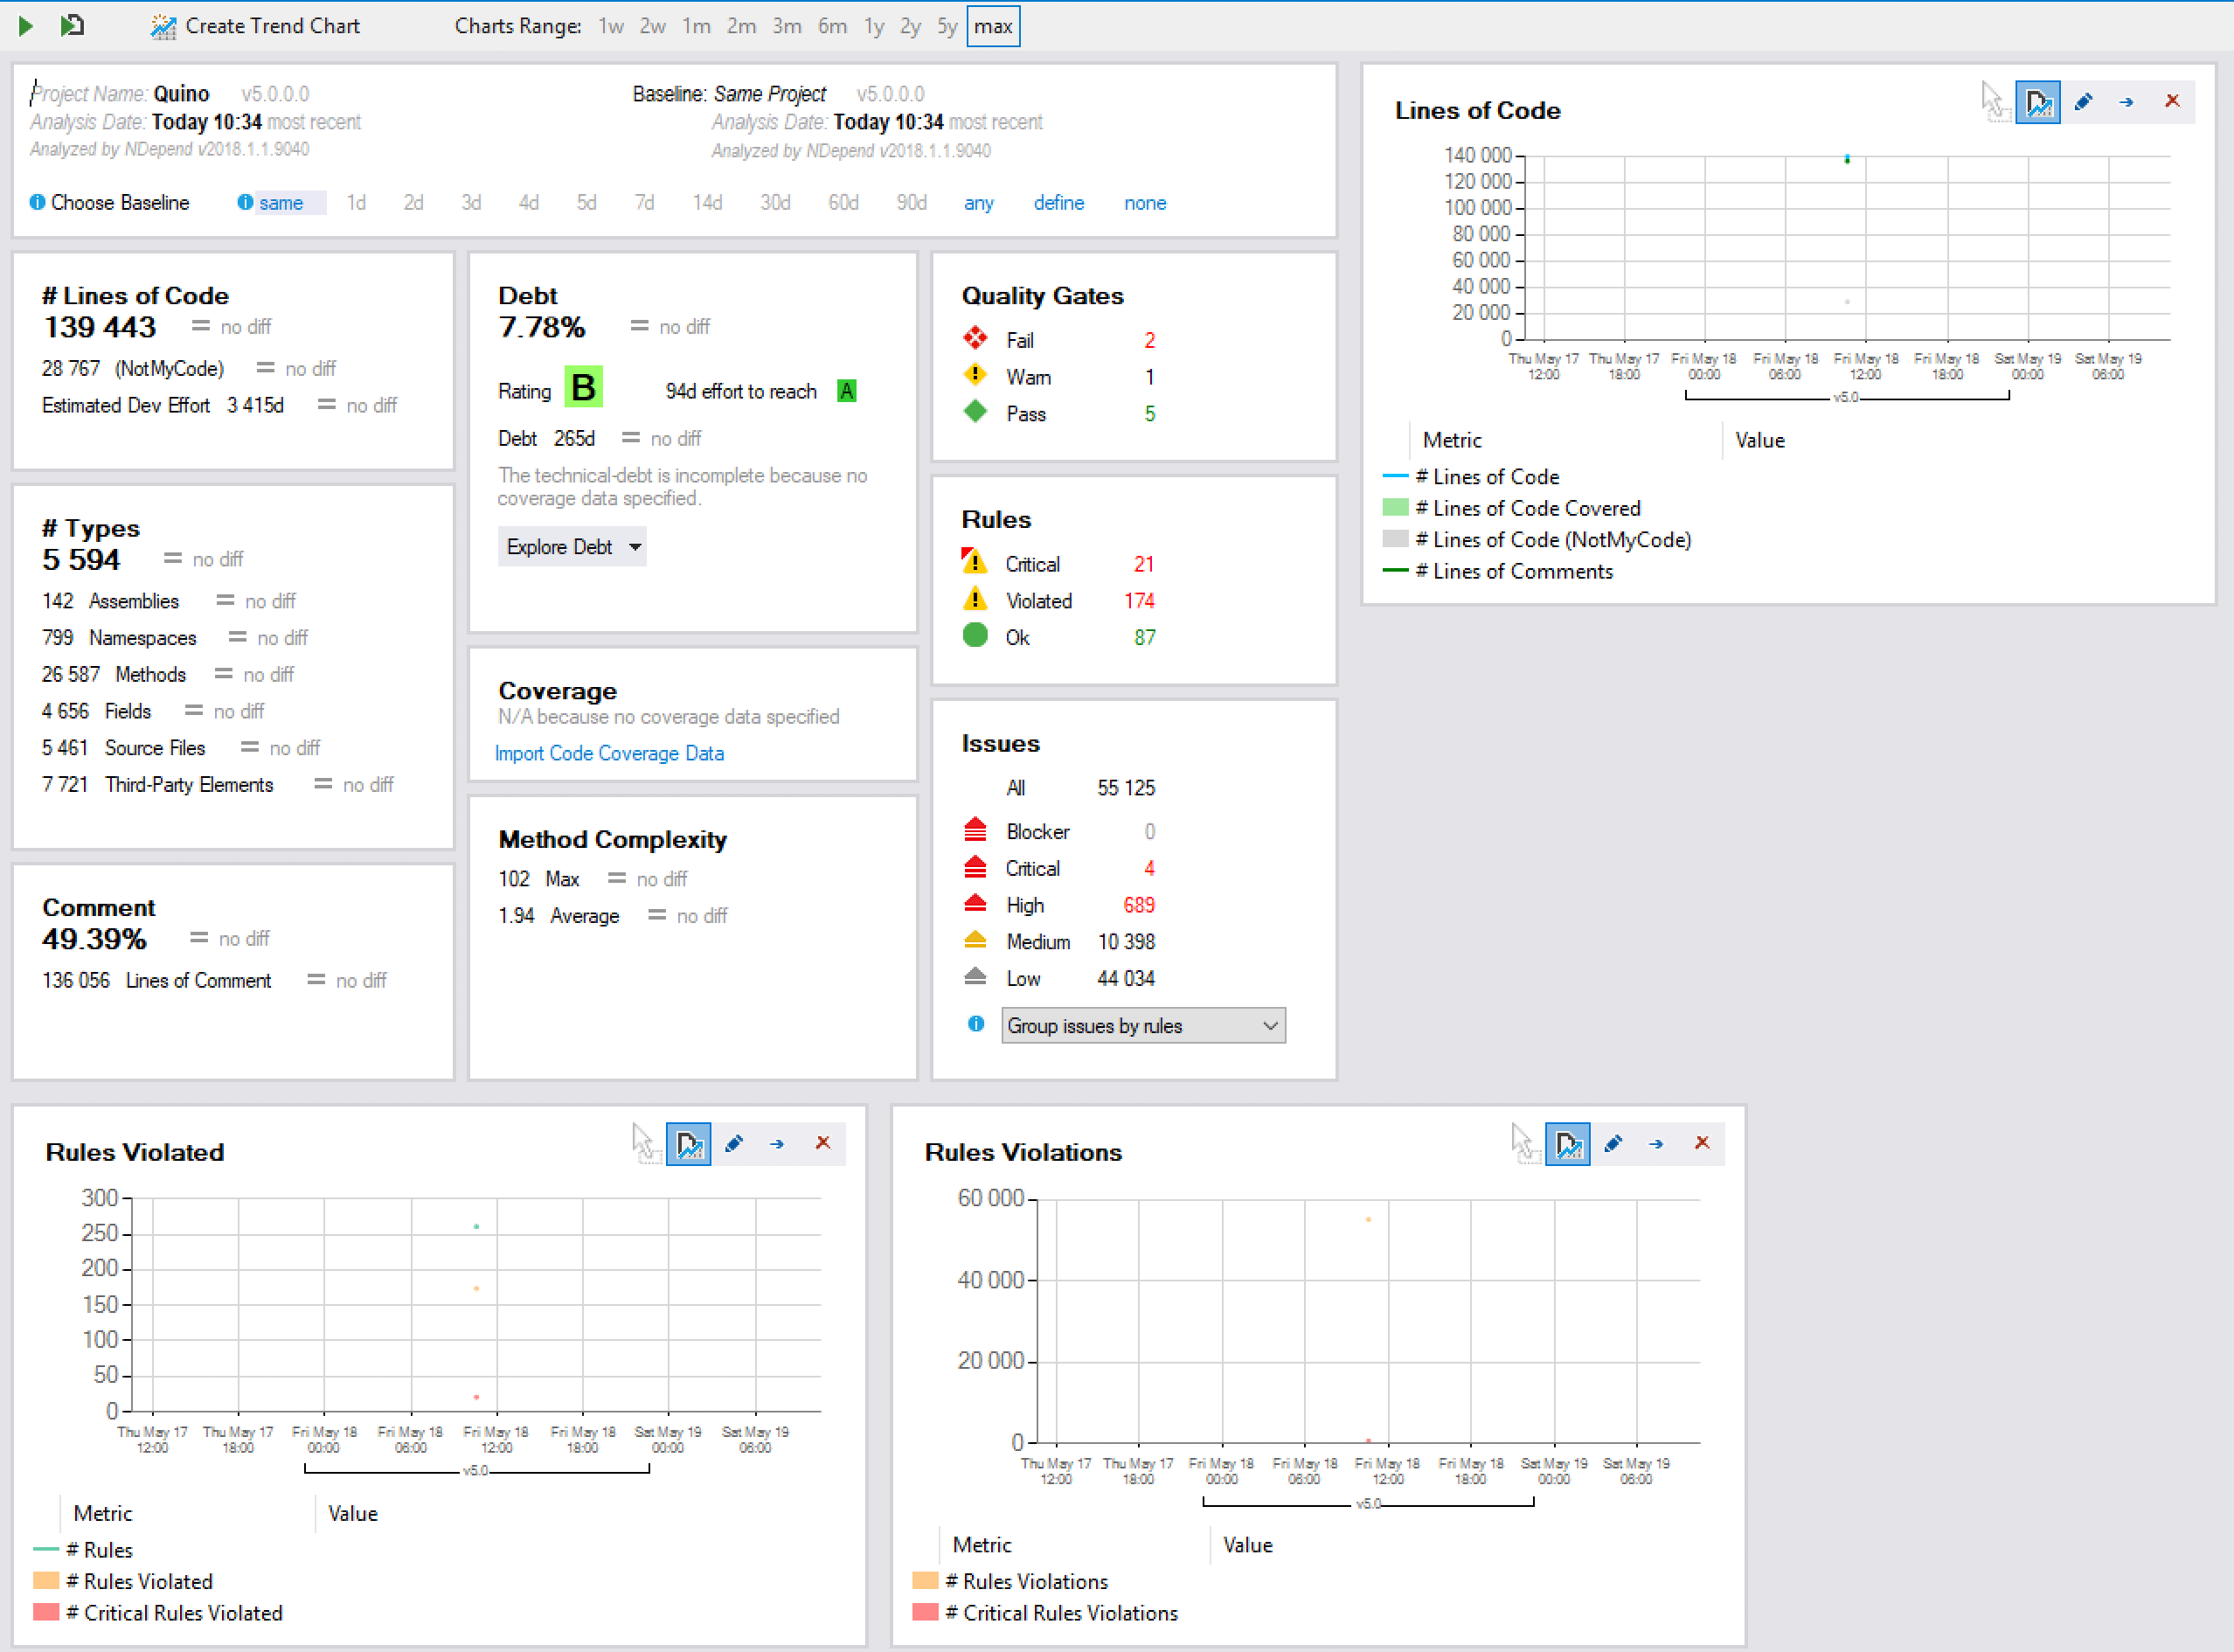
The amount of information can be quite daunting but the latest incarnation of the dashboard is quite easy to read. All data is presented with a current number and a delta from the analysis against which you’re comparing. Since I haven’t run an analysis in a while, there’s no previous data against which to compare, but that’s OK.
- Lines of Code
- Code Elements (Types, Methods, etc.)
- Comments (documentation)
- Technical Debt
- Code Coverage[5]
- Quality Gates / Rules / Issues
Let’s start with the positive.
- The Quino sources contain almost 50% documentation. That’s not unexpected. The XML documentation from which we generate our developer documentation[6] is usually as long as or longer than the method itself.
- We have a solid B rating for technical debt, which is really not bad, all things considered. I take that to mean that, even without looking, we instinctively produce code with a reasonable level of quality.
Now to the cool part: you can click anything in the NDepend dashboard to see a full list of all of the data in the panel.
Click the “B” on technical debt and you’ll see an itemized and further-drillable list of the grades for all code elements. From there, you can see what led to the grade. By clicking the “Explore Debt” button, you get a drop-down list of pre-selected reports like “Types Hot Spots”.
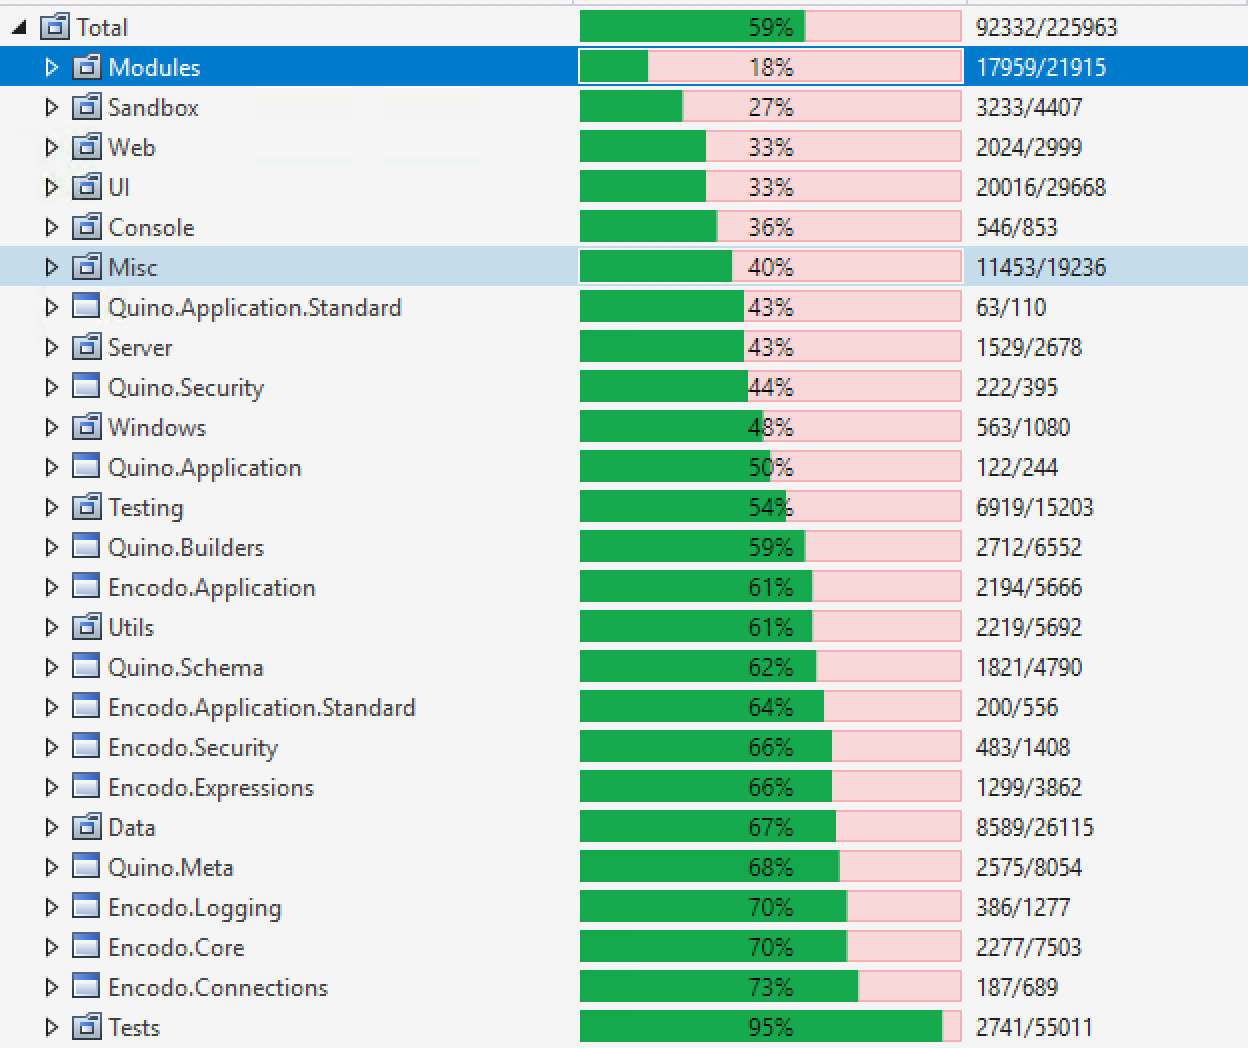
Click lines of code and you get a breakdown of which projects/files/types/methods have the most lines of code
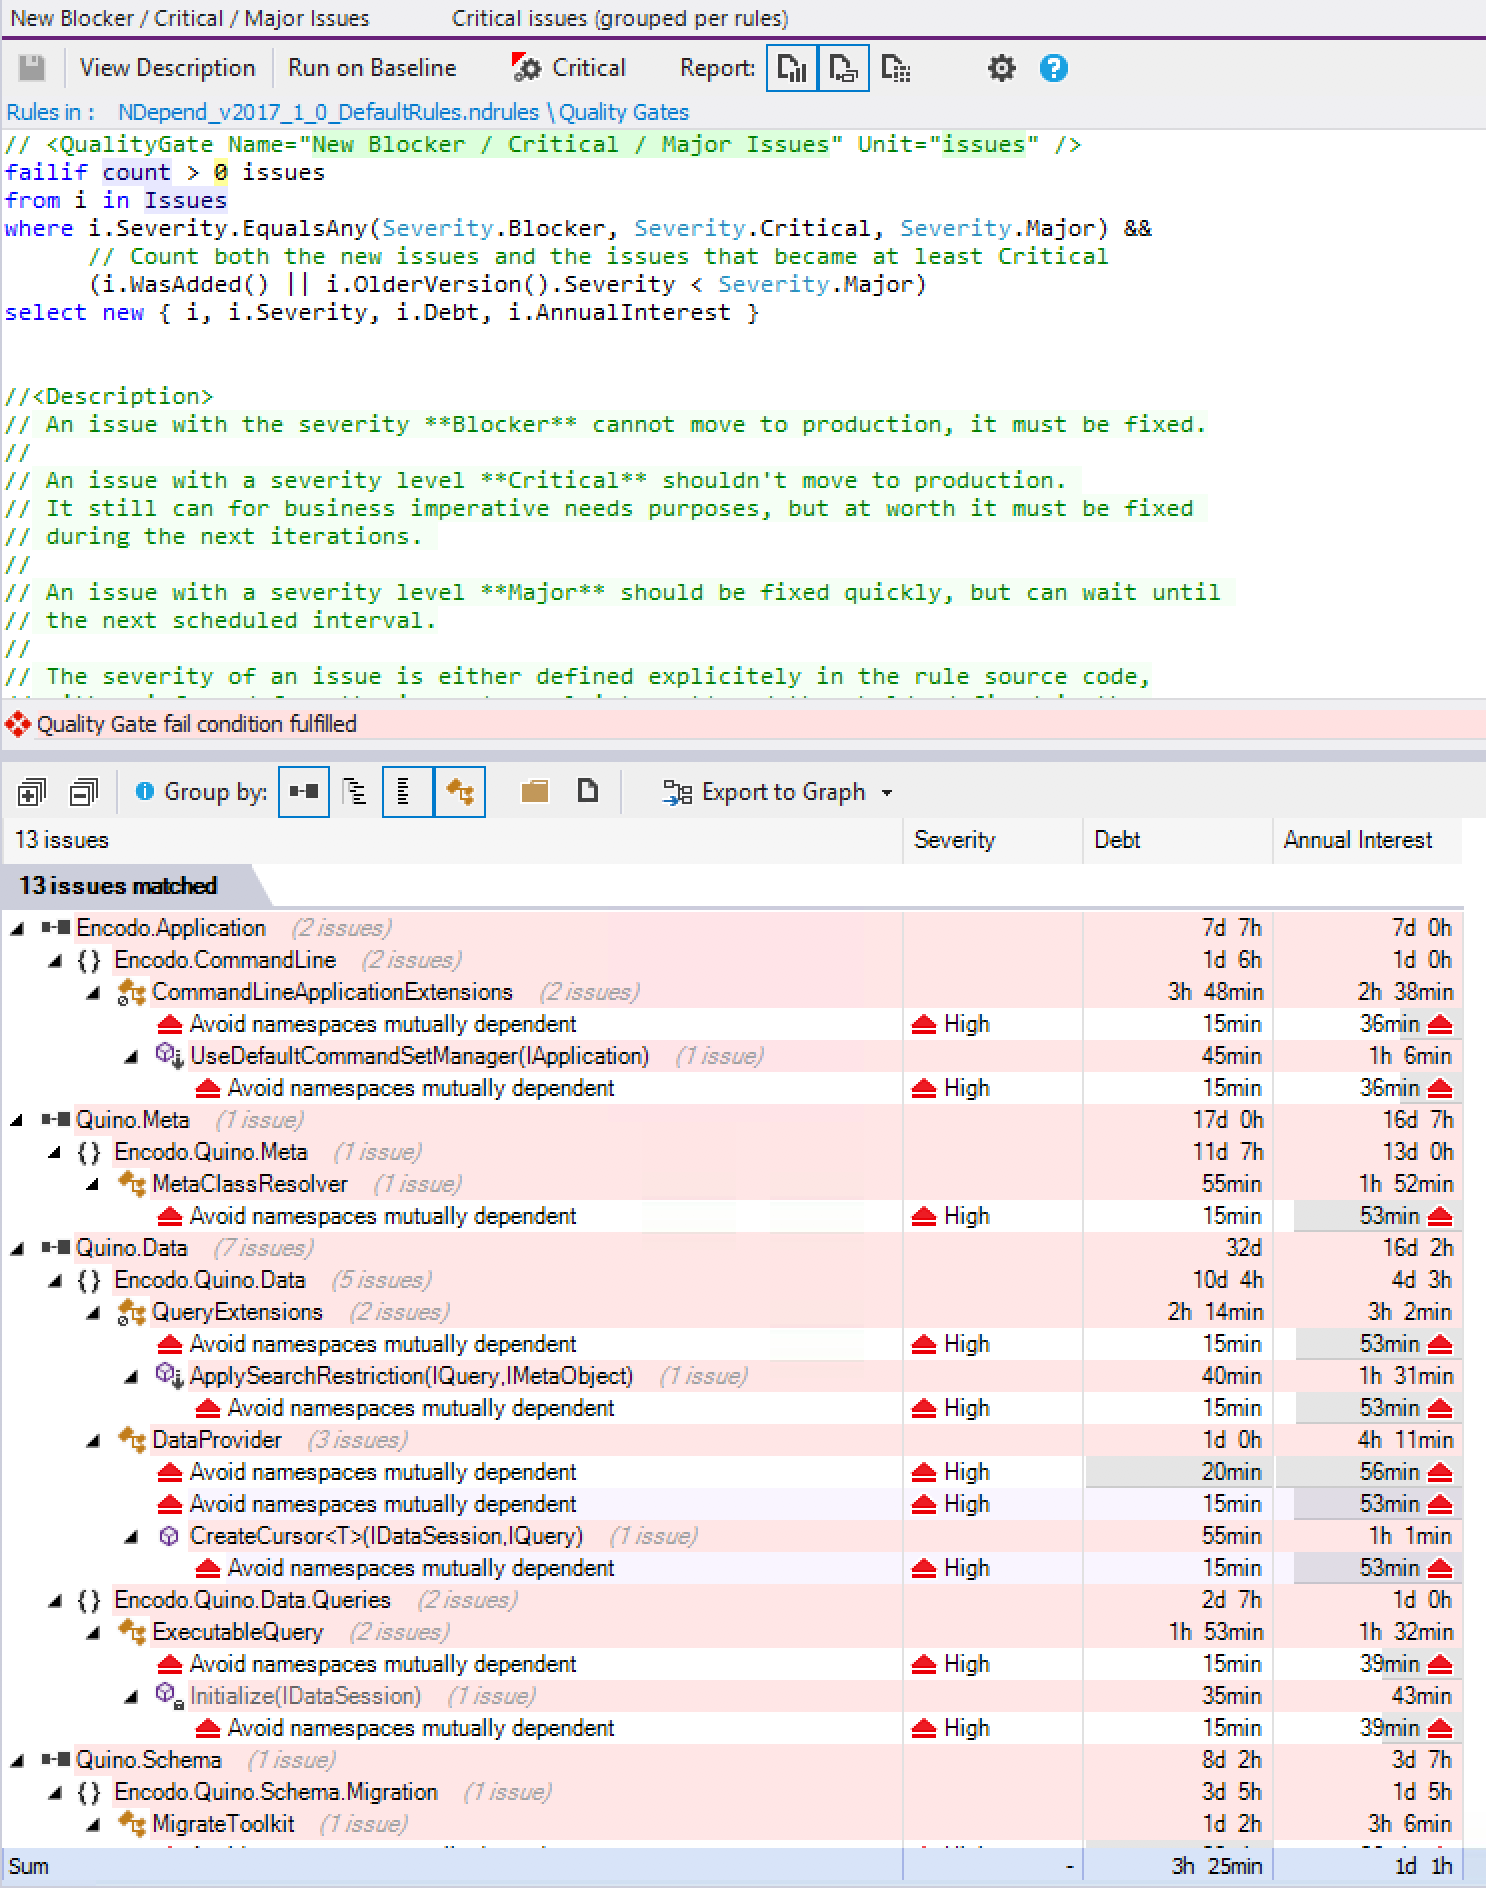
Click failed quality gates to see where you’ve got the most major problems (Quino currently has 3 categories)
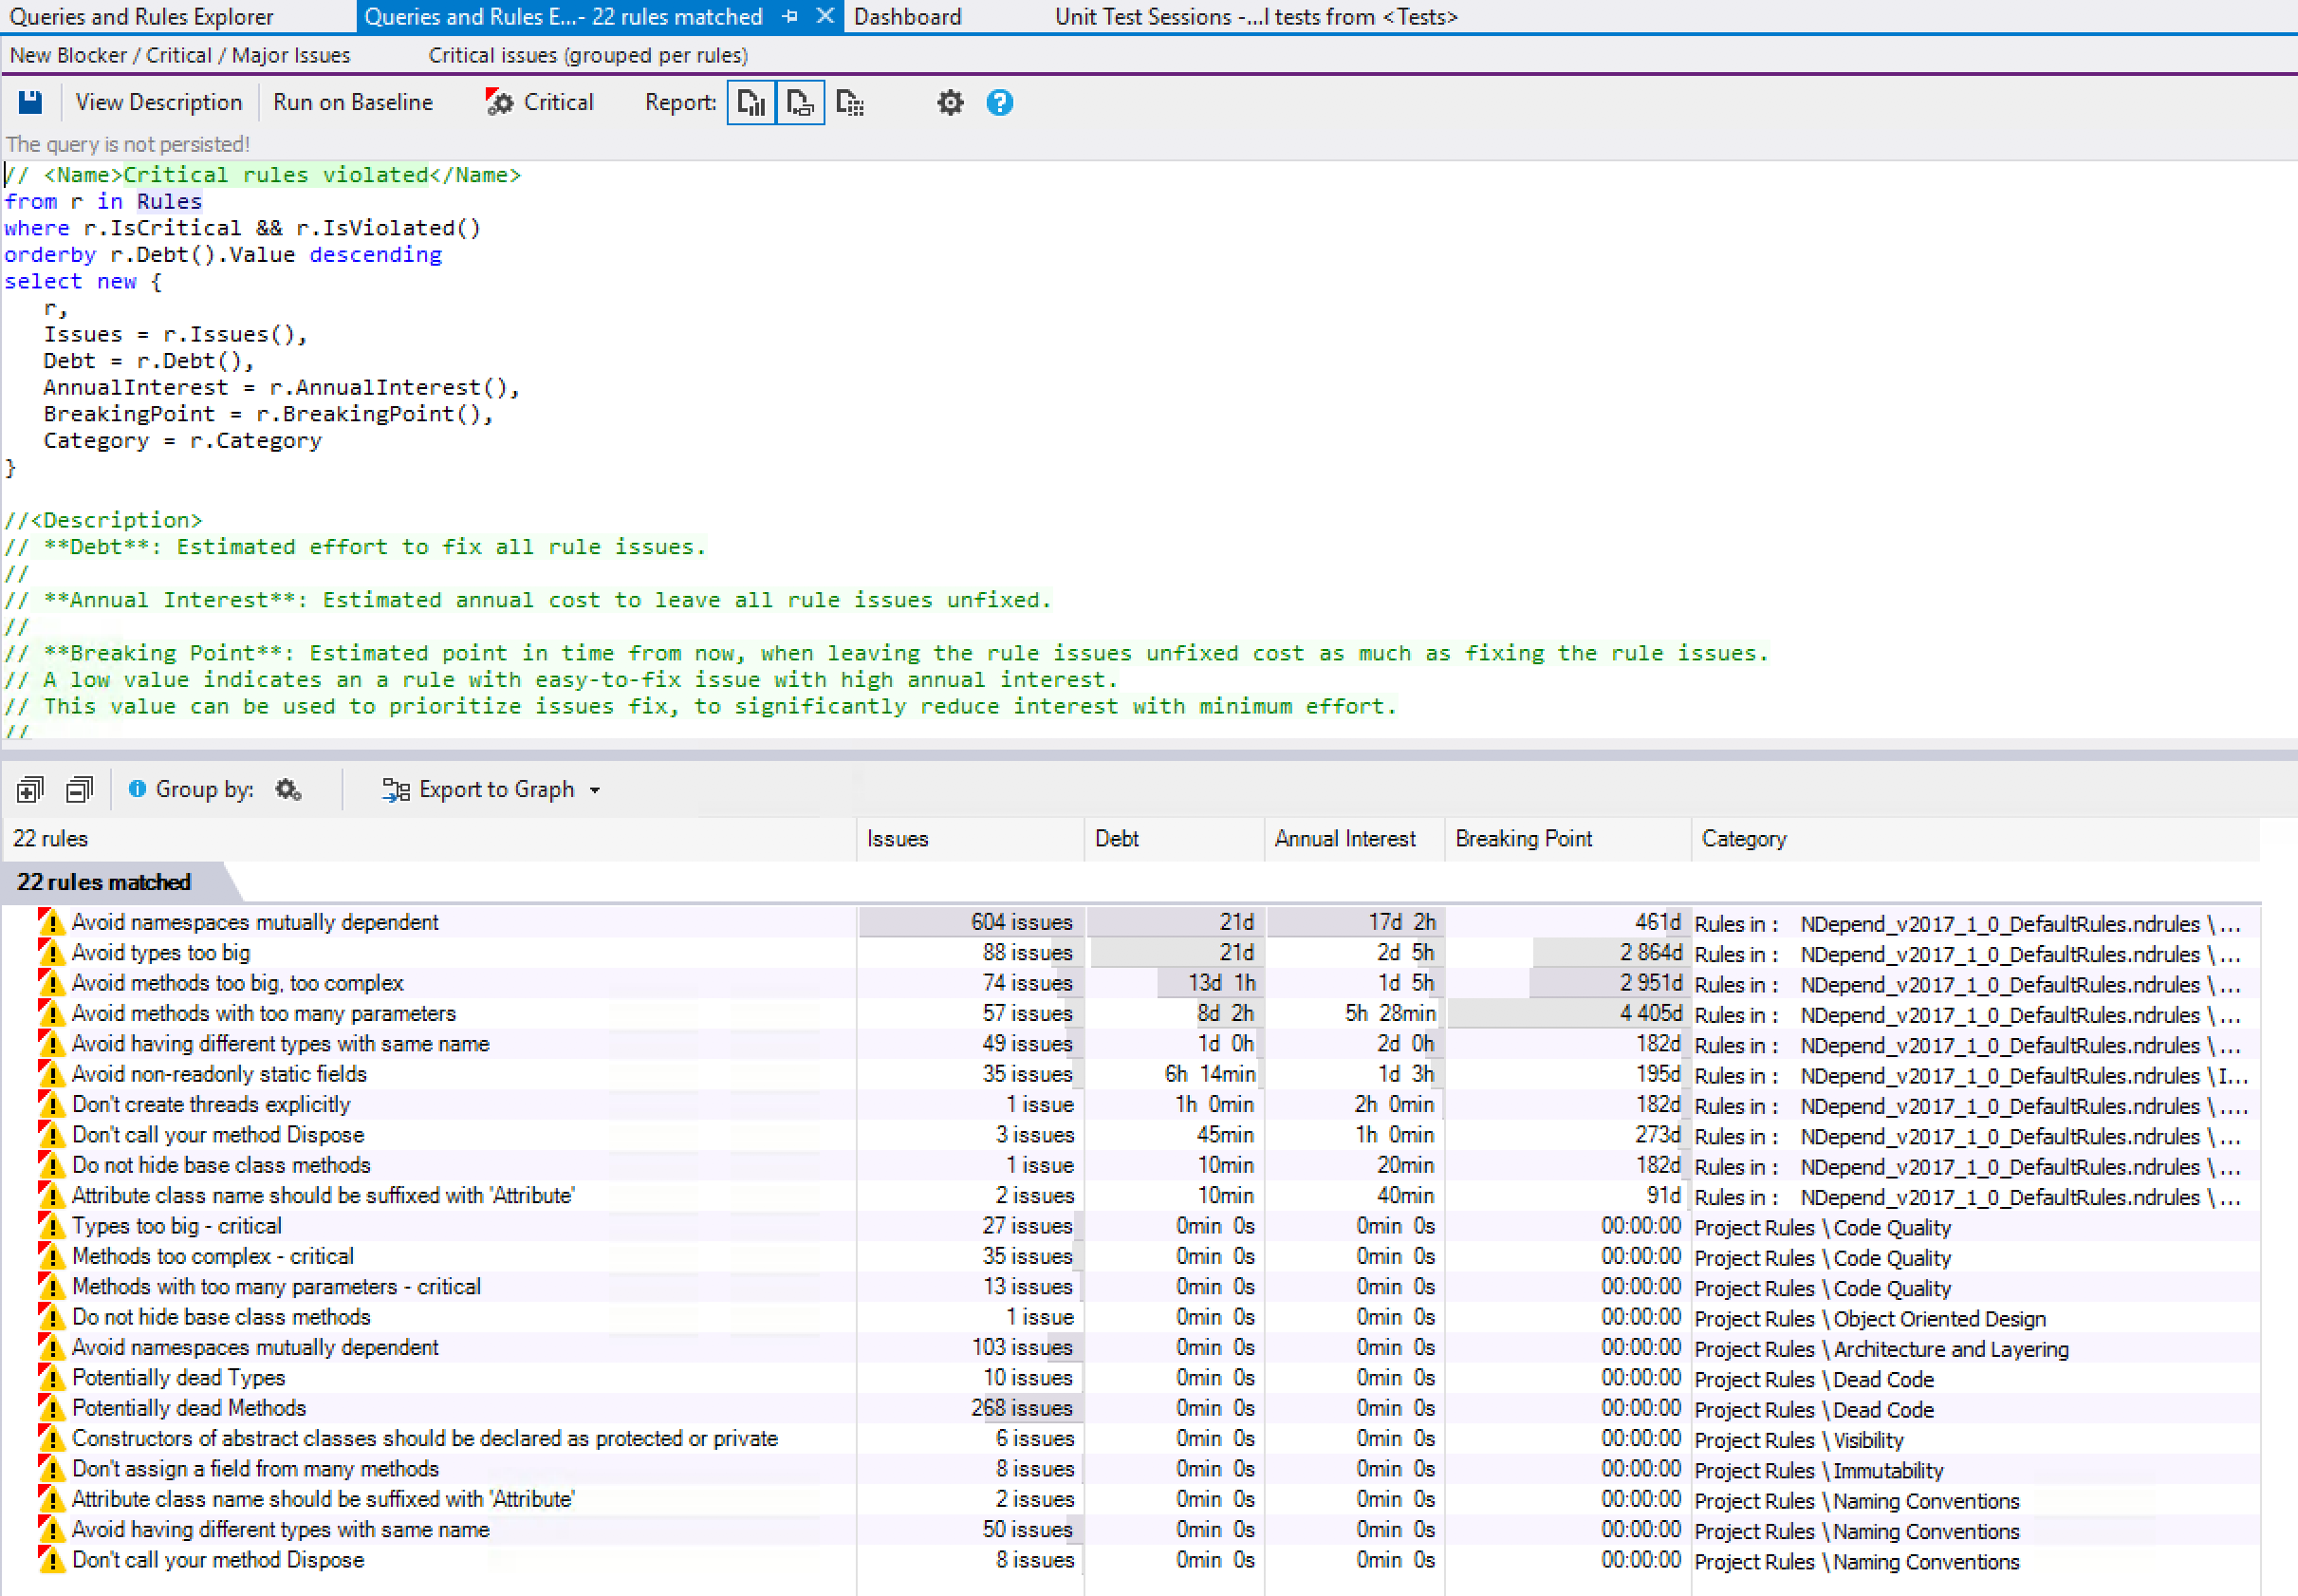
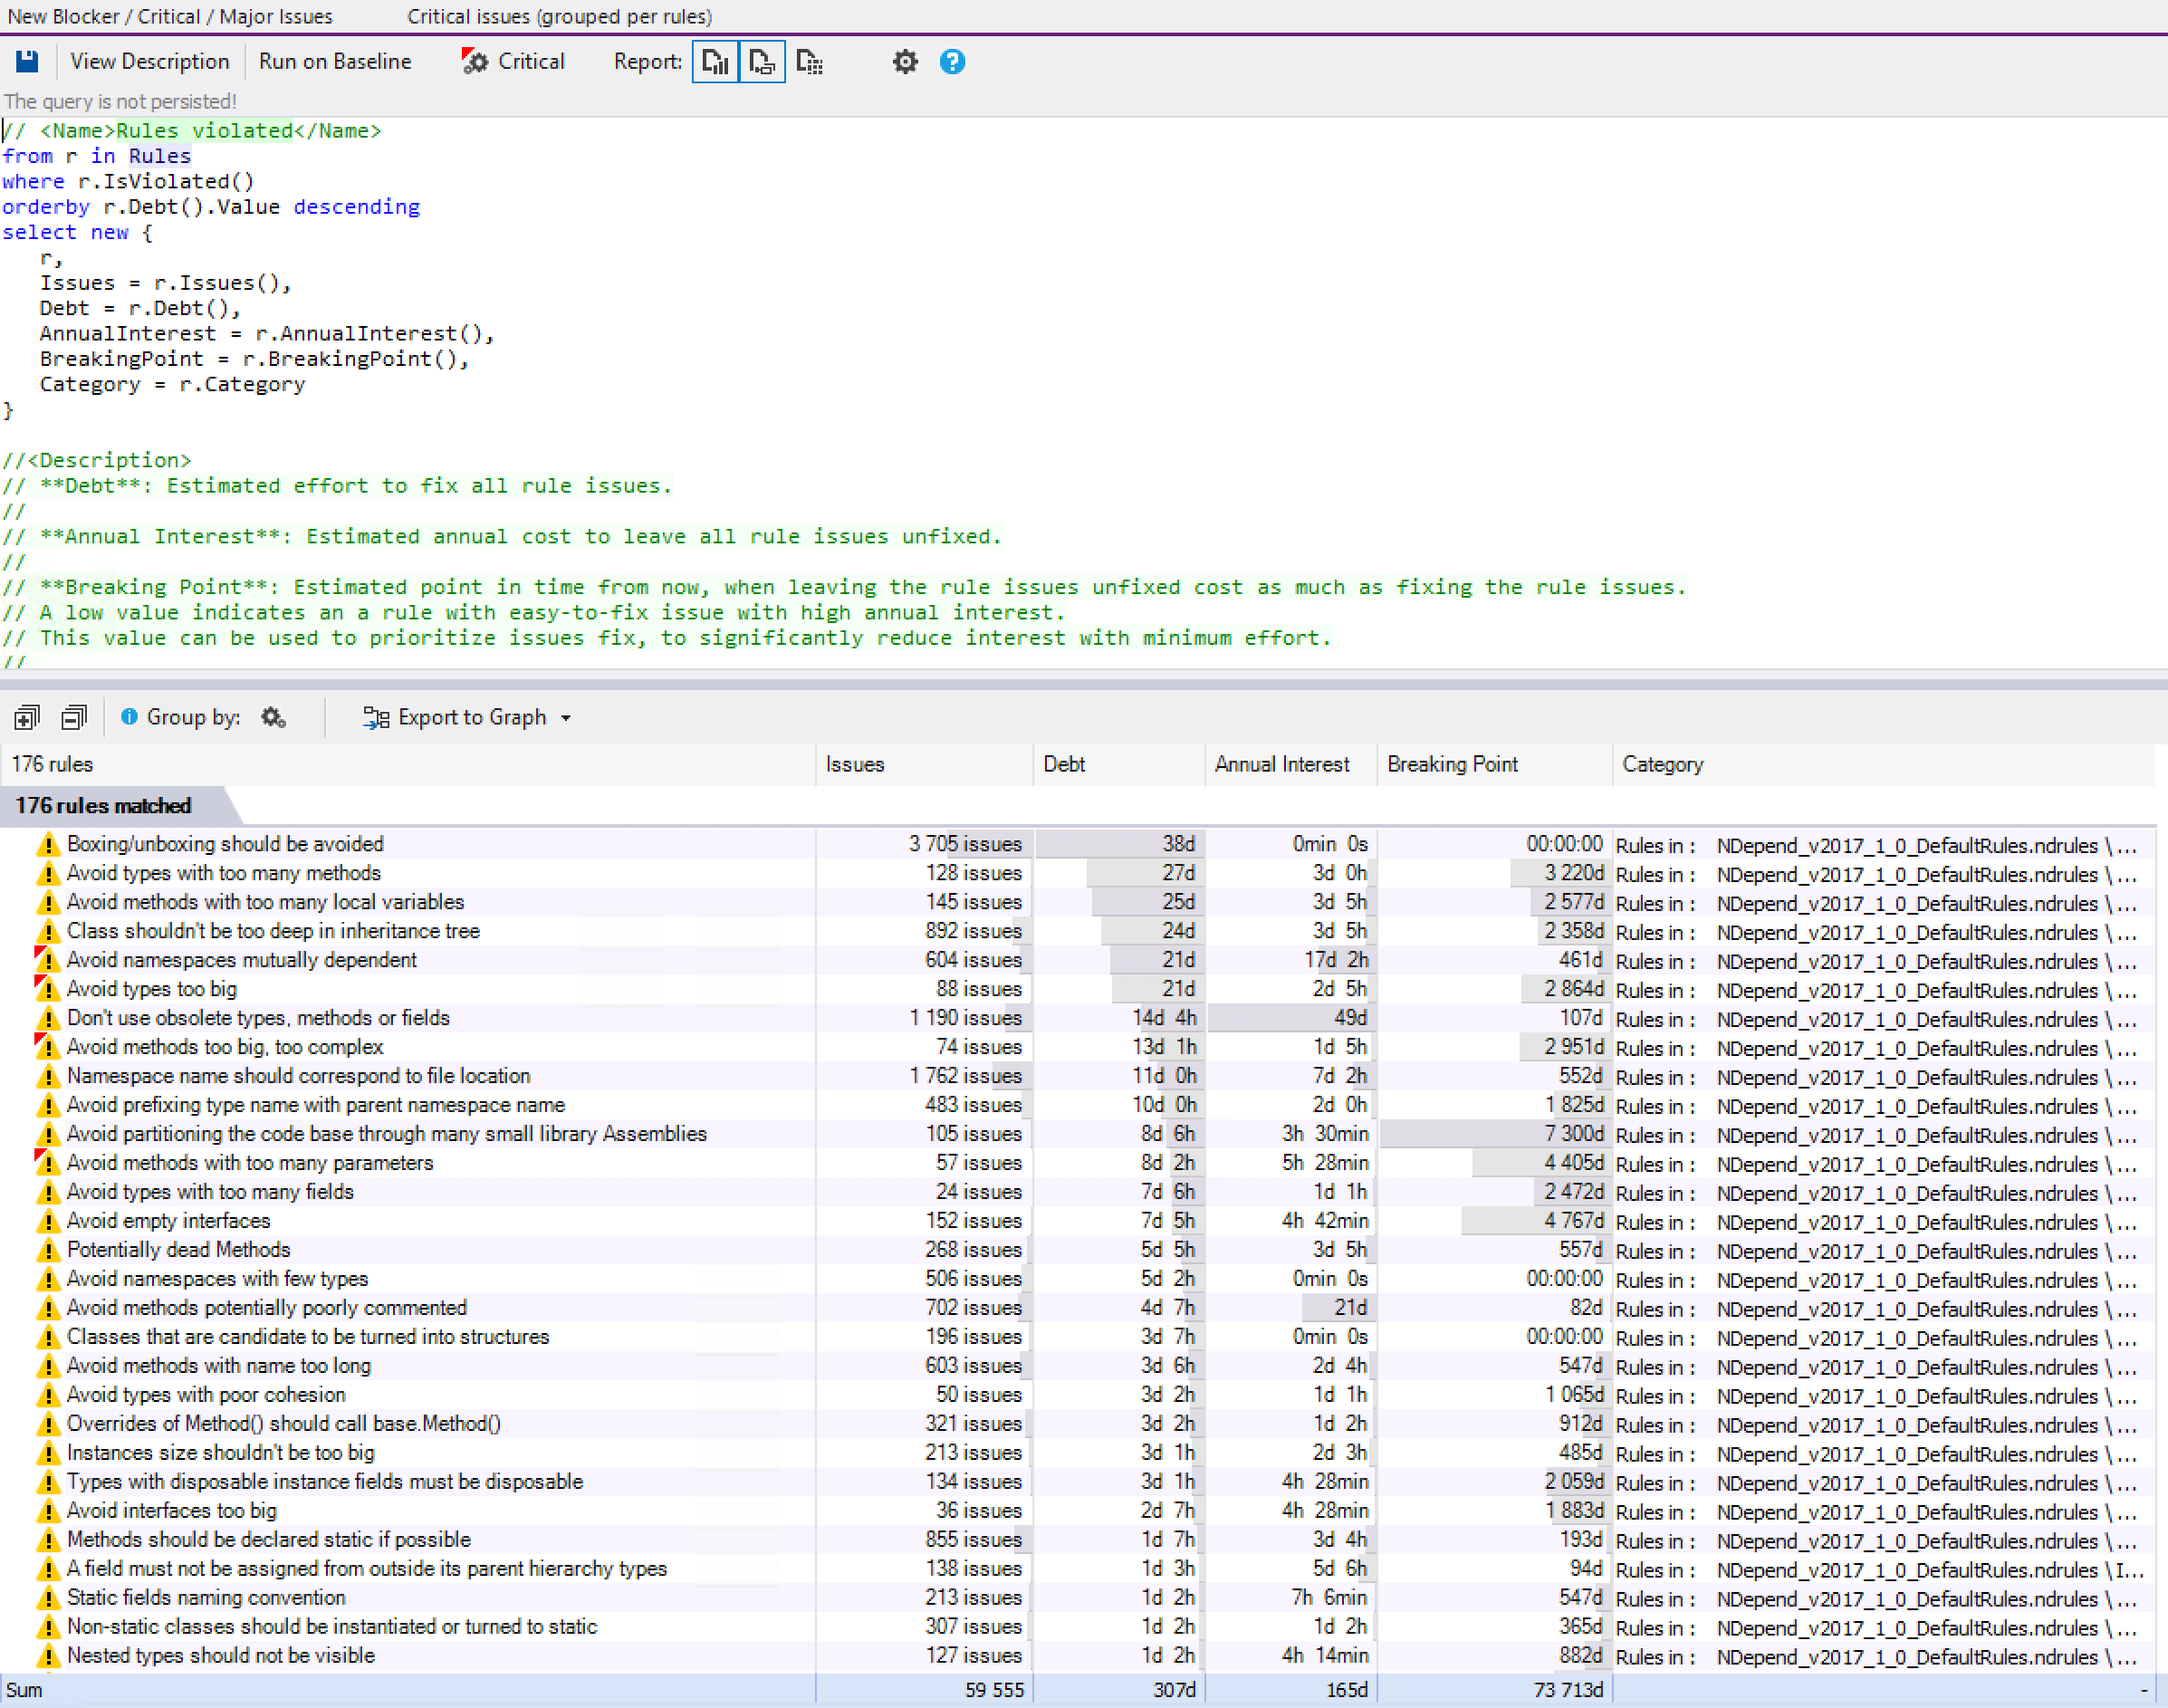
Click “Critical” or “Violated” rules to see architectural rules that you’re violating. As with everything in NDepend, you can pick and choose which rules should apply. I use the default set of rules in Quino.
Most of our critical issues are for mutually-dependent namespaces. This is most likely not root namespaces crossing each other (though we’d like to get rid of those ASAP) but sub-namespaces that refer back to the root and vice-versa. This isn’t necessarily a no-go, but it’s definitely something to watch out for.
There are so many interesting things in these reports:
- Don’t create threads explicitly (this is something we’ve been trying to reduce; I already knew about the one remaining, but it’s great to see it in a report as a tracked metric)
- Methods with too many parameters (you can adjust the threshold, of course)
- Types too big: we’d have to check these because some of them are probably generated code, in which case we’d remove them from analysis.
- Abstract constructors should be protected: ReSharper also indicates this one, but we have it as a suggestion, not a warning, so it doesn’t get regularly cleaned up. It’s not critical, but a code-style thing. I find the NDepend report much easier to browse than the inspection report in TeamCity.
Click the “Low” issues (Quino has over 46,000!) and you can see that NDepend analyzes your code at an incredibly low level of granularity
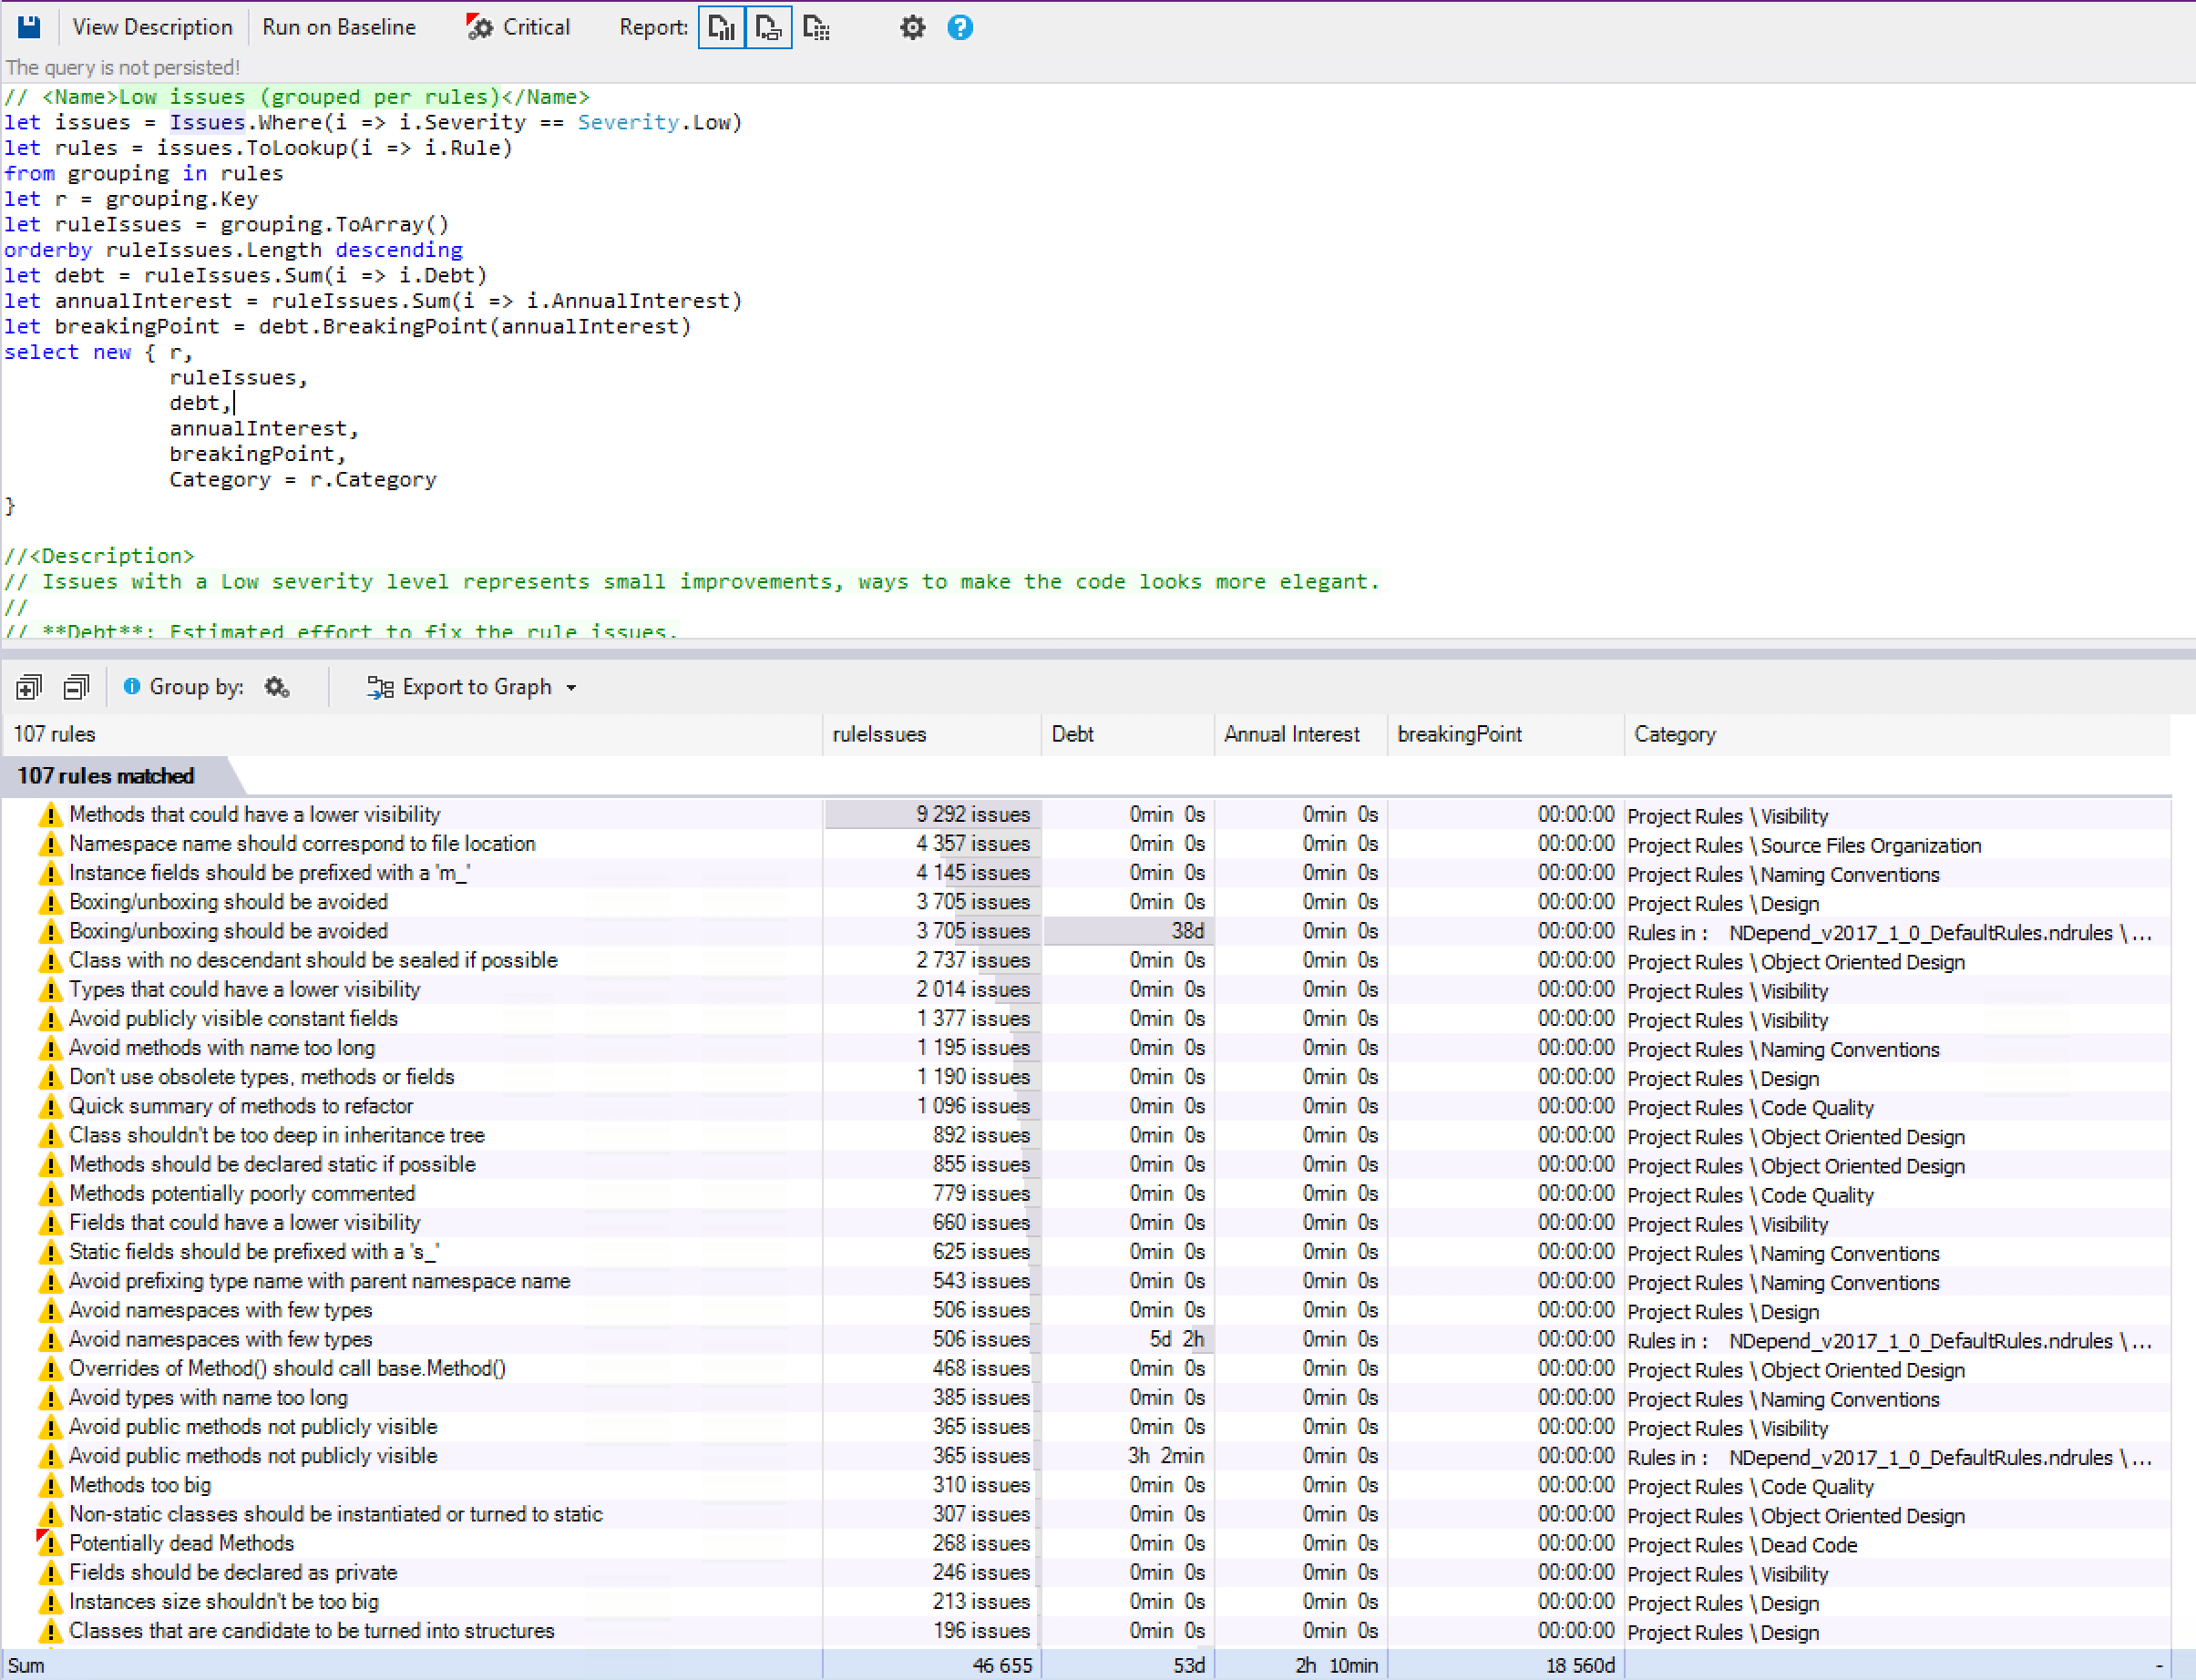
- There are almost 10,000 cases where methods could have a lower visibility. This is good to know, but definitely low-priority.
- Namespace does not correspond to file location: I’m surprised to see 4,400 violations because I thought that ReSharper managed that for us quite well. This one bears investigating – maybe NDepend found something ReSharper didn’t or maybe I need to tweak NDepend’s settings.
Finally, there’s absolutely everything, which includes boxing/unboxing issues[7], method-names too long, large interfaces, large instances (could also be generated classes).
These already marked as low, so don’t worry that NDepend just rains information down on you. Stick to the critical/high violations and you’ll have real issues to deal with (i.e. code that might actually lead to bugs rather than code that leads to maintenance issues or incurs technical debt, both of which are more long-term issues).
What you’ll also notice in the screenshots that NDepend doesn’t just provide pre-baked reports: everything is based on its query language. That is, NDepend’s analysis is lightning fast (takes only a few seconds for all of Quino) during which it builds up a huge database of information about your code that it then queries in real-time. NDepends provides a ton of pre-built queries linked from all over the UI, but you can adjust any of those queries in the pane at the top to tweak the results. The syntax is Linq to Sql and there are a ton of comments in the query to help you figure out what else you can do with it.
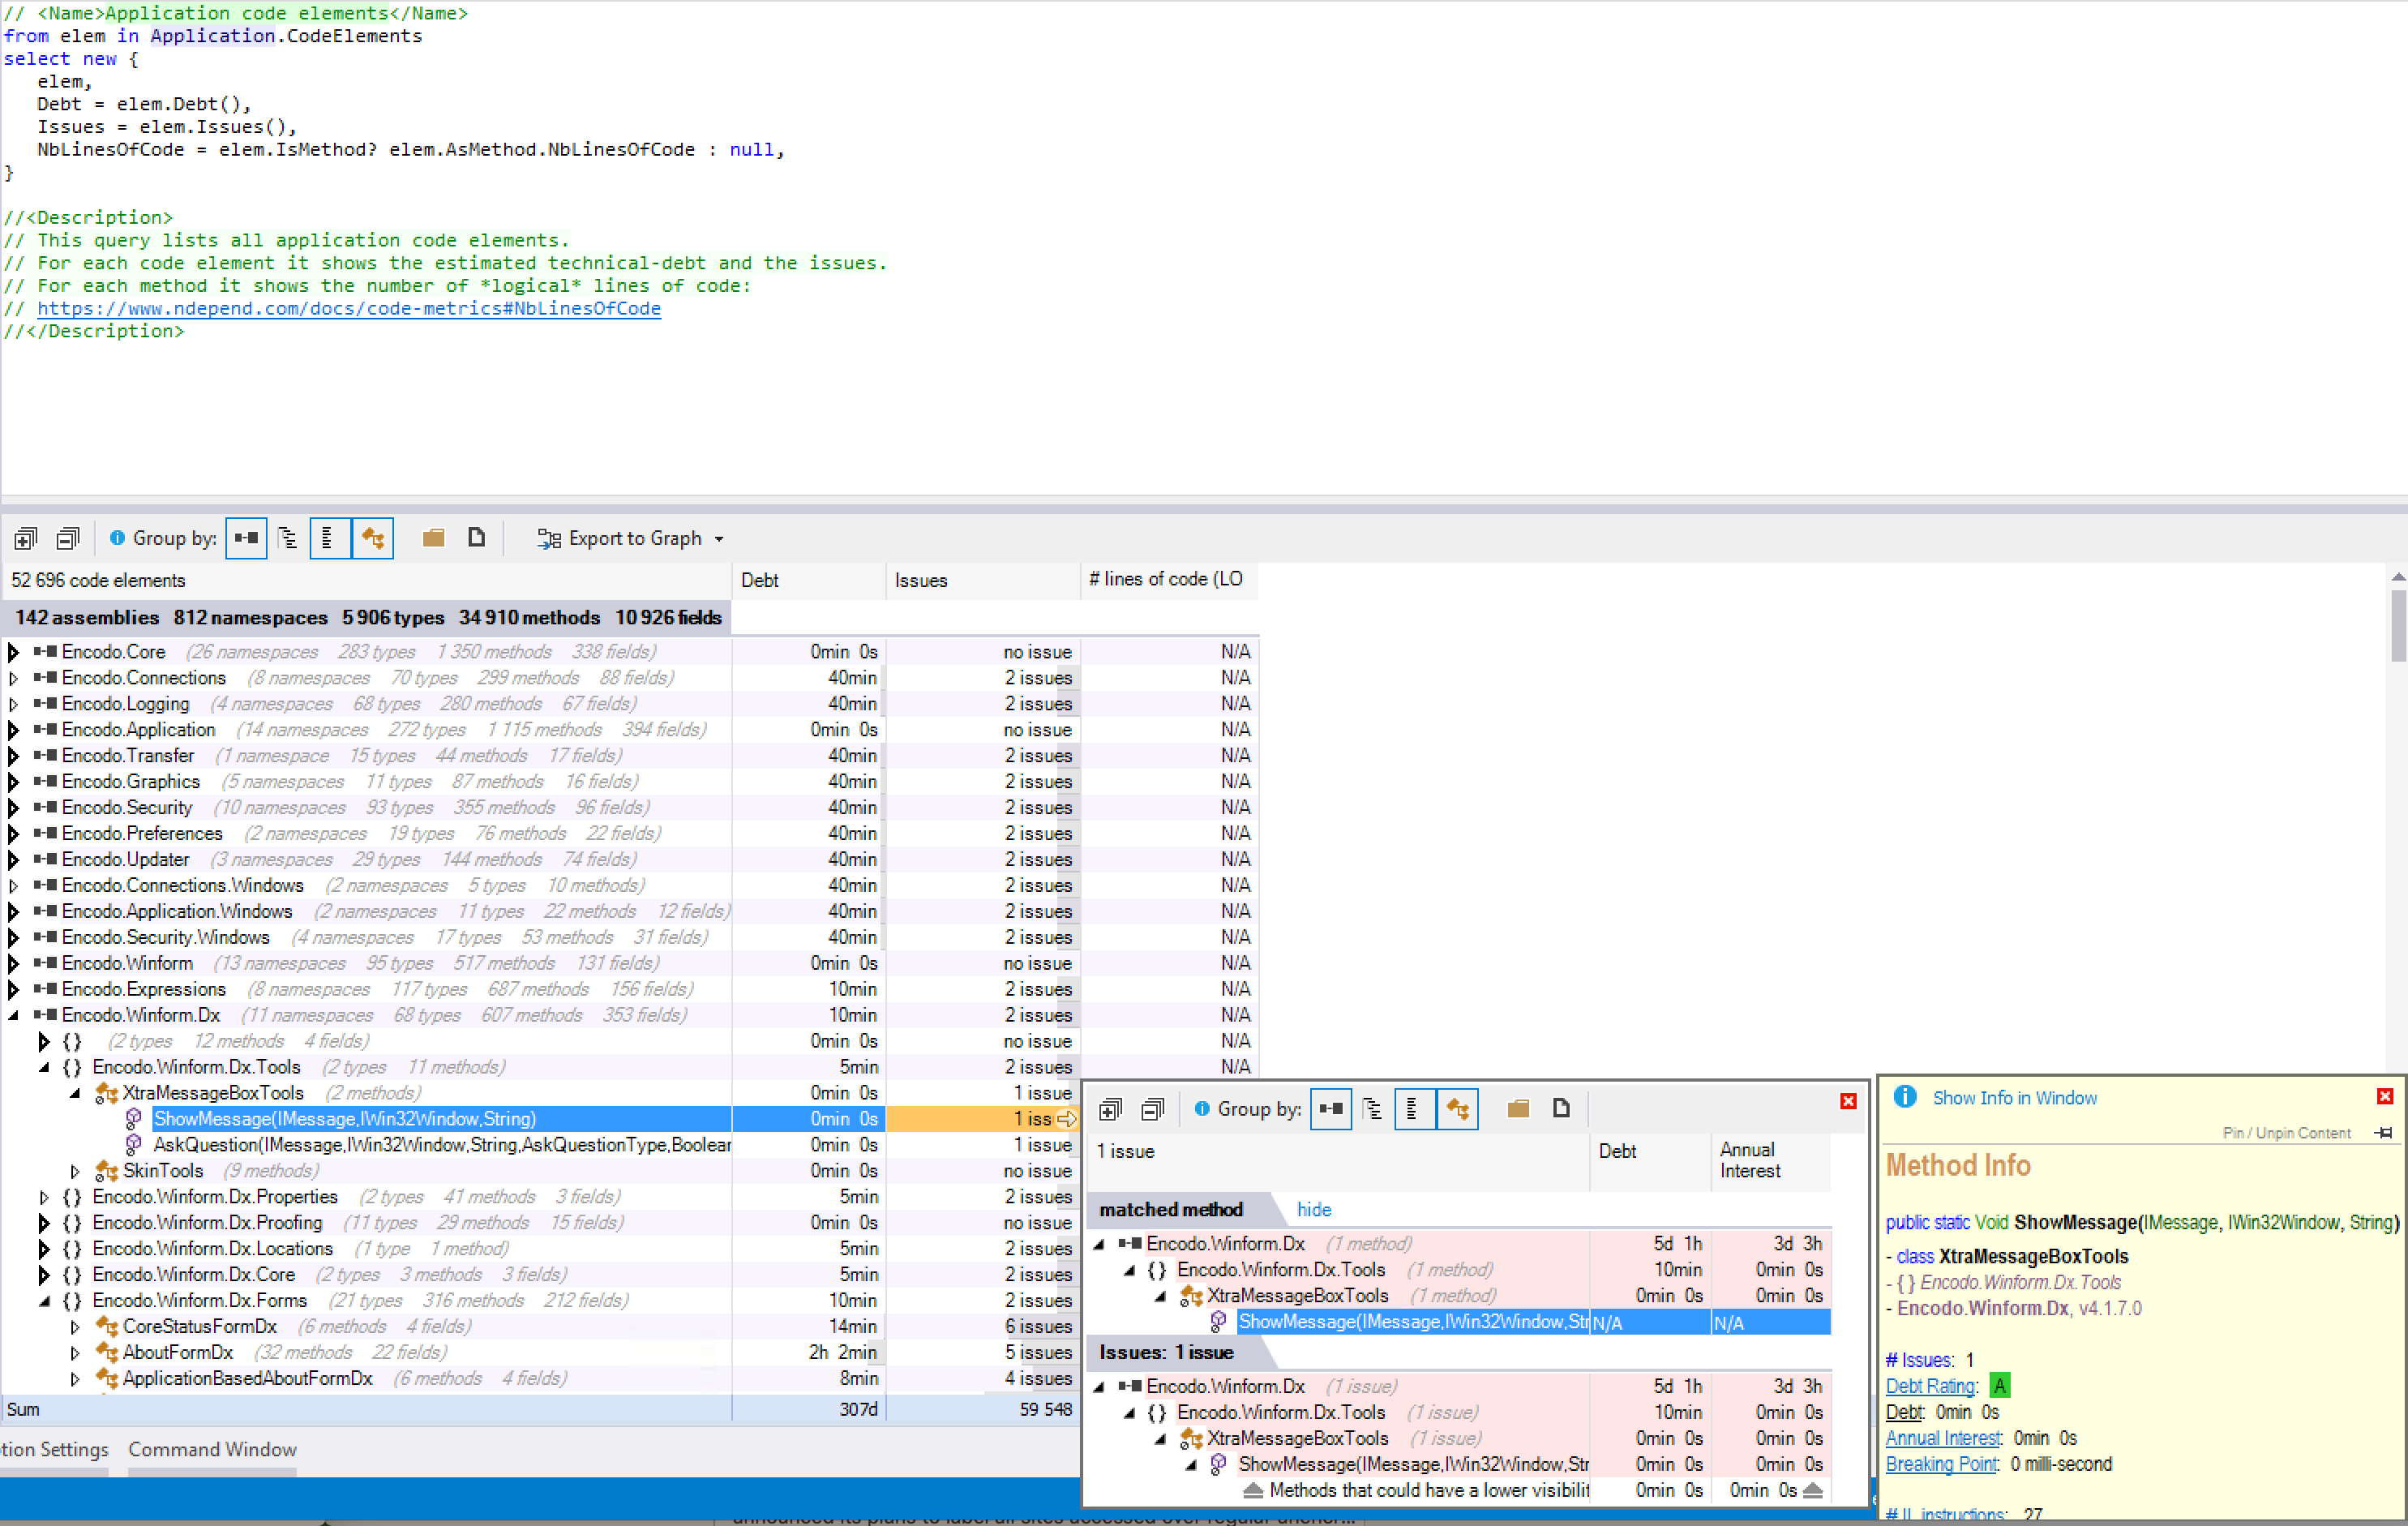
As noted above, the amount of information can be overwhelming, but just hang in there and figure out what NDepend is trying to tell you. You can pin or hide a lot of the floating windows if it’s all just a bit too much at first.
In our case, the test assemblies have more technical debt than the code that it tests. This isn’t optimal, but it’s better than the other way around. You might be tempted to exclude test assemblies from the analysis, to boost your grade, but I think that’s a bad idea. Testing code is production code. Make it just as good as the code it tests to ensure overall quality.
I did a quick comparison between Quino 4 and Quino 5 and we’re moving in the right direction: the estimation of work required to get to grade A was already cut in half, so we’ve made good progress even without NDepend. I’m quite looking forward to using NDepend more regularly in the coming months. I’ve got my work cut out for me.
nant clean command. I’d moved the ndepend out folder to the common folder and our command wiped out the previous results. I’ll work on persisting those better in the future.↩I generated coverage data using DotCover, but realized only later that I should have configured it to generate NDepend-compatible coverage data (as detailed in NDepend Coverage Data. I’ll have to do that and run it again. For now, no coverage data in NDepend. This is what it looks like in DotCover, though. Not too shabby: